GNSS Spectrum Function and Low-power Anti-interference Technology for ComNav Technology K8-series GNSS Module

1. Anti-interference technology introduction
Low-power Anti-interference (LAI) technology is ComNav patented advanced anti-narrowband and anti-continuous-wave interference technology. The SNR can reach 60dB and the power consumption is only 0.1W when enabled.
LAI technology can quickly detect and mitigate interference through a simple setup to ensure the safety of equipment during operation.
In the latest firmware version, the K8-series GNSS module has added advanced interference detection and suppression features, which can detect and suppress radio interference sources. At the same time, we added a technology that can output interference source spectrum data, which can be used to detect interference types and possible interference sources.
2. Spectrum function in MyPort Software
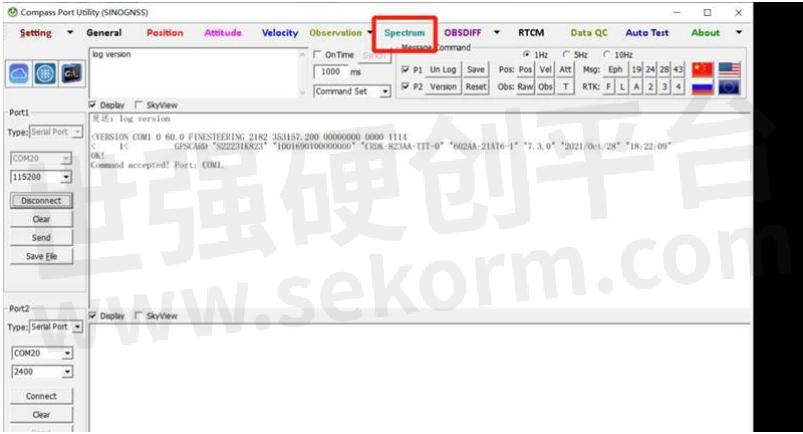
Clients can use ComNav MyPort software to detect and mitigate interference.
Open MyPort, select Spectrum in the software, check the scan frequency and scan range, and adjust the scan frequency manually.
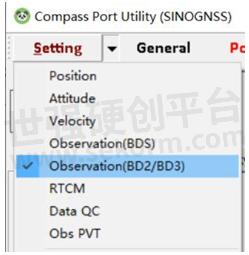
And select "Observation (BD2/BD3)" in Setting.
You can set the scanning Frequency and Range in the Frequency Spectrum Setting.
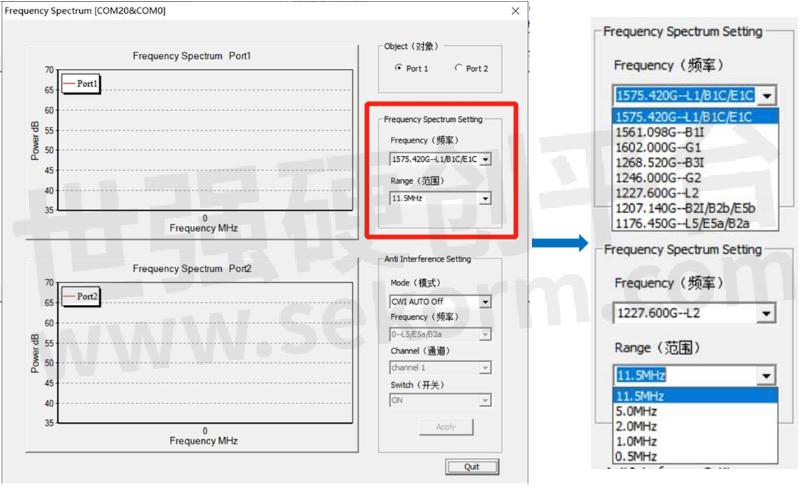
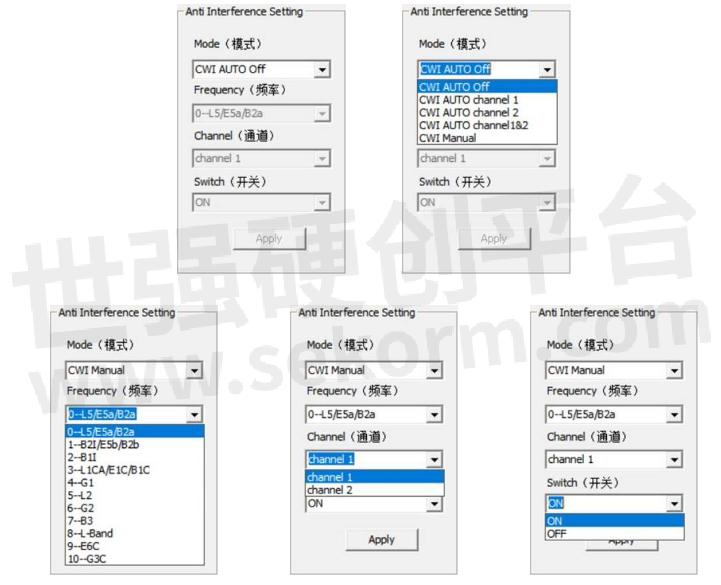
For setting anti-interference, you can select the mode you needed.
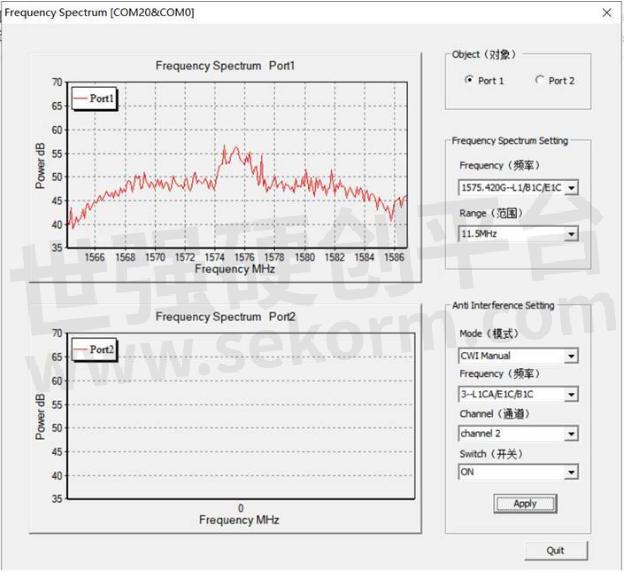
When ‘CWI Manual’ is not selected, the frequency, channel, and switch are not selectable; When‘CWI Manual’ is selected, you can manually configure the frequency, channel, and switch.
3. Example
Here is an example showing the whole steps.
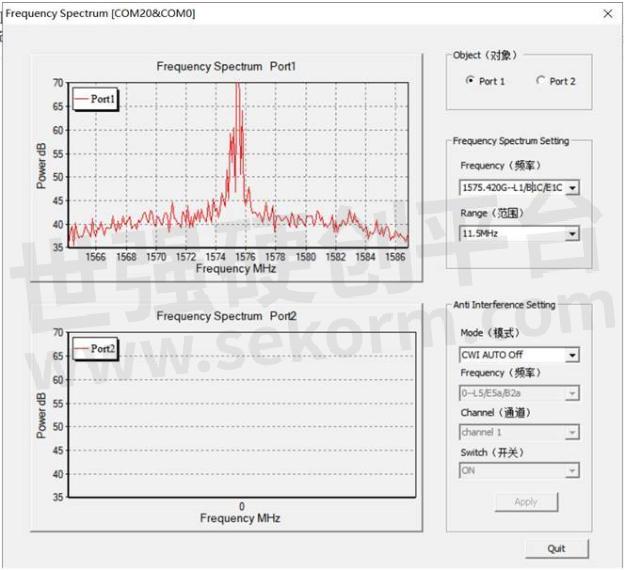
The test jamming frequency is on GPS L1. 60 dBm interference was added at 1.57542GHz using an RF signal generator as interference.
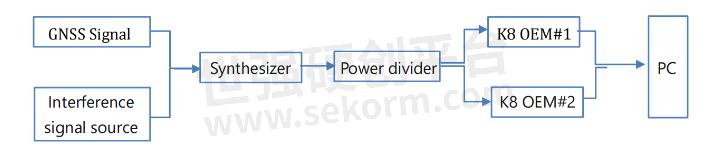
The device is connected as shown in the figure below. The satellite signal and the interference signal provided by the RF signal generator are sent to the module to be tested by the confluence. The signal-to-noise ratio and positioning status are concerned.
Note: The default scan number is 200.
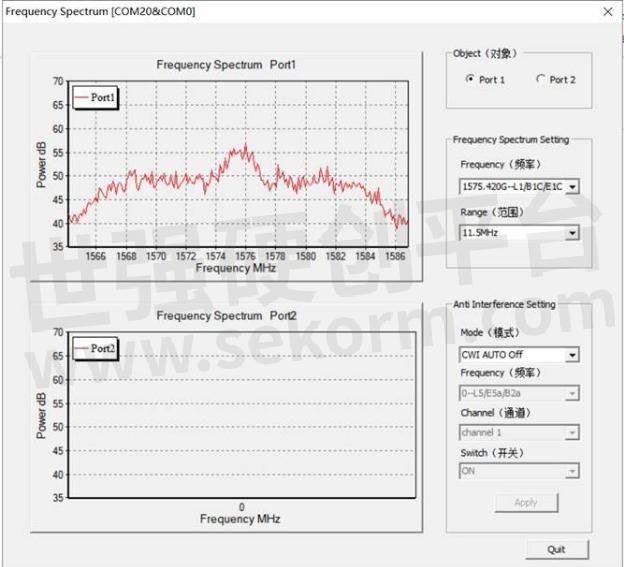
(1) Spectrum diagram when only GNSS signal is connected.
(2) Spectrum diagram of adding interference signal source.
(3) Spectrum diagram after acting anti-interference
4. Data Analyze
If the user needs data for further analysis, the data can be decoded by the Binary_MsgDecode tool. A column of data can be obtained by decoding, and the data can be imported into EXCEL for plotting. The horizontal coordinate is the scanning frequency, which can be obtained according to the scanning frequency and scanning range of the central point set by the user. The ordinate is the interference intensity, which can be obtained by the formula dBm=20log(A). (A is the scan value)
4.1 Commands introduction
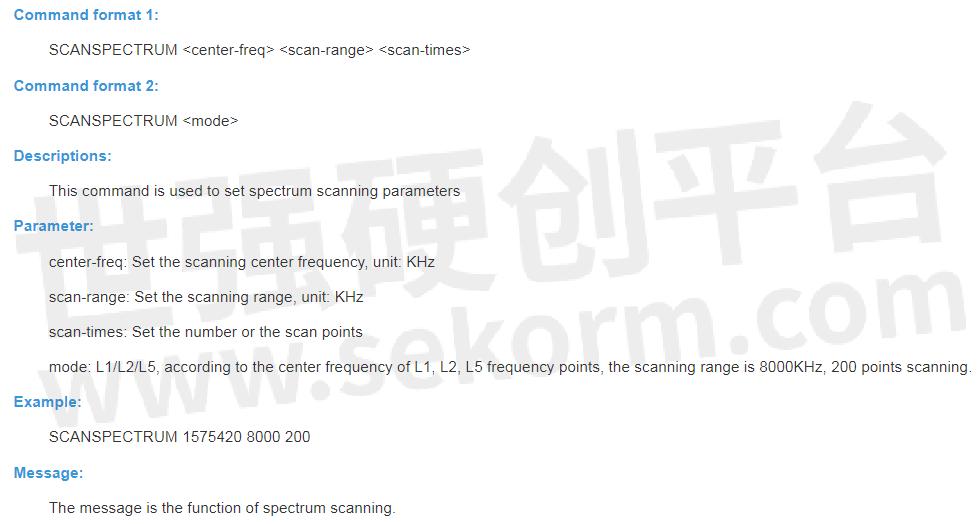

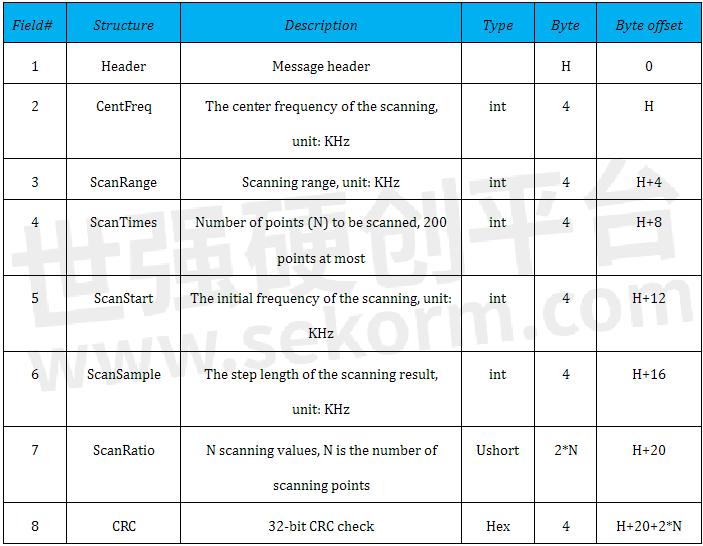
Message Structure:
4.2 Data playback
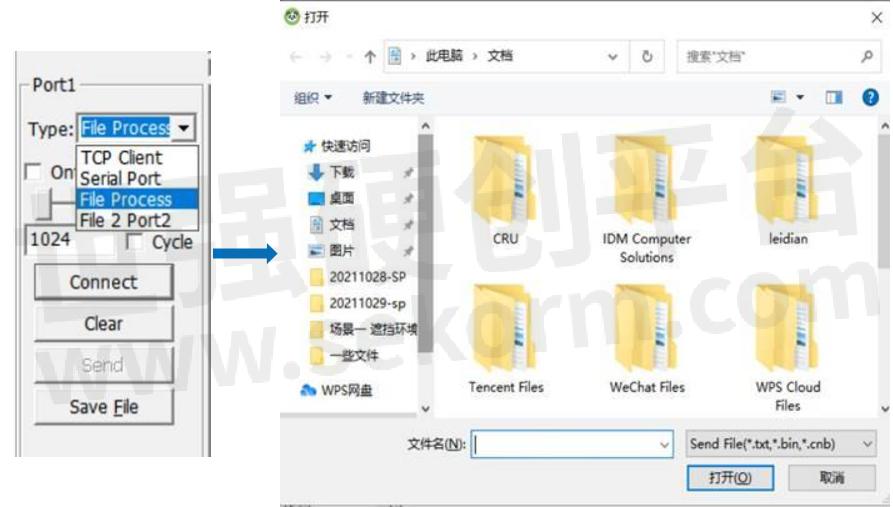
‘MyPort’ software supports the data playback function. Users can play back the saved data according to their needs. Disconnect the connection, select ‘File Process’, and click ‘Connect’, and the folder will automatically jump out, and users can choose.
4.3 Data decode
Open the ‘Binary_MsgDecode’ software, drag the file in, and click ‘ENTER’, it will auto decode a file named ‘Message2264.log’, the client can use it for further analysis.
- +1 Like
- Add to Favorites
Recommend
- The Magic Behind RTK: Delivering Unparalleled Positioning Precision
- How to Active the Event Option for Your GNSS Module K8 series from ComNav Technology
- Recommend Commands for System Integration
- ComNav‘s K8 Series GNSS Module can track the Galileo E6b signal and Has Verified the HAS Service in Most Countries
- Lighter, Thinner, Faster - ComNav Technology Introduced T20 Palm RTK
- How to Enable GNSS+INS System on ComNav K8 Series GNSS Modules
- ComNav Technology Launched GNSS High Precision Positioning Solution for Lawn Mower
- ComNav Technology‘s Z30 Portable GNSS Receiver: Precision in Your Pocket
This document is provided by Sekorm Platform for VIP exclusive service. The copyright is owned by Sekorm. Without authorization, any medias, websites or individual are not allowed to reprint. When authorizing the reprint, the link of www.sekorm.com must be indicated.
Integrated Circuits


Discrete Components


Connectors & Structural Components


Assembly UnitModules & Accessories


Power Supplies & Power Modules


Electronic Materials


Instrumentation & Test Kit


Electrical Tools & Materials


Mechatronics


Processing & Customization