Boosting Your Manufacturing Analytics System with Keysight’s Pathwave Manufacturing Analytics (PMA)
Manufacturing Analytics is not something new. In fact, most manufacturers are either already using commercial Manufacturing Execution Systems (MES) or have their home-grown manufacturing analytics catered to their needs. In some cases, factories may have multiple manufacturing analytics systems in place to meet diverse operational needs.
Most of the existing manufacturing analytics systems focus on operational Key Performance Index (KPI) such as Overall Equipment Efficiency (OEE), throughput, and yield. These KPIs are some of the major performance metrics for manufacturers to increase their revenue and ROIC with better capacity utilization. However, for mission-critical industries such as automotive and cloud server manufacturers, product quality trumps all else when it comes to what matters most in terms of profitability, competitiveness, and growth. If anything 2022 material shortage and the pandemic have taught us, it is that you can use the money to buy capacity where everyone was rushing to secure expensive long lead-time manufacturing equipment, but you can’t use the money to buy quality.
Product quality can be assessed through various means, and one of them is by calculating the Cost of Poor Quality (COPQ), a concept popularized by IBM quality expert H. James Harrington in his 1987 book Poor Quality Costs. The cost of poor quality refers to the total cost incurred by producing defective products or boards. As a defective product should never be shipped to the end customer, it is best to detect any issues internally, either by OEM (Original Equipment Manufacturer) or CM (Contract Manufacturer). Rework, scrap, and re-inspection costs are all examples of internal defect costs incurred due to defects found before the product or board is shipped to the customer. Most significantly, the amount of times the product is being handled directly correlates to field failures resulting from electrostatic discharge, stress, contamination, mix-ups, and general mishandling.
Bridging the Trust Gap: Enhancing Visibility in Manufacturing Analytics
Both rework and scraps can adversely affect productivity, quality, and profitability. While tracking these metrics within the same entity is relatively easy, identifying the root cause of the failure and implementing corrective actions and process improvements can be challenging and time-consuming. This challenge becomes even more significant in the context of the global manufacturing industry, where multiple CMs may produce the same product for an OEM. In such cases, rationalization and clarifications of the reasons for rework and scrap are necessary to build trust between CMs and OEMs. This often leads to wasted time and effort to generate multiple reports and getting on many calls to disposition for scraps. Besides, scraps and rework are just one of the KPIs the OEM tracks.
Moreover, rework and scrap are just two of the many KPIs the OEM tracks, including test coverage, Cpk, board anomalies, and failure rate. The need for multiple report generation on different KPIs is a symptom of a more significant problem: a lack of visibility.
Imagine if there was a way for the OEM to know what is happening on the production floor without waiting on the CMs to respond. At the same time, the CMs could proof-check their observations and results using the same dataset provided to the OEM. Having visibility into the actual manufacturing scene would undoubtedly bridge the trust gap between the CMs and OEMs.
Below are a few examples of how PMA addresses the issues mentioned above:
One of them is the Test Coverage Monitor and changed alert. Product quality is the primary and essential requirement in the manufacturing process that cannot be compromised. Test coverage buyoff must be performed prior to releasing products to mass production to ensure that all components and functionality are tested with the proper upper and lower limits of the desired specification. However, manufacturers often face challenges such as incorrect limit changes and skipped tests, which can jeopardize the quality metric.
The real-time automated Test Coverage Monitor detects any changes in test coverage for testing the quality of the products or device-under-test (DUT). Rather than relying on manual data entry by operators for checking solutions, Keysight's PMA has developed an automated learning process within the Test Coverage Monitor. This system learns in real time as it analyzes data, enabling it to improve its accuracy and effectiveness continuously.
Test Coverage changed alert (Figure 1) will be triggered when the number of test execution registered for a passing board exceeds the baseline reference. With that, the user can immediately track down this board via its serial number, investigate the test names in differences, and reroute the affected boards back to ensure the execution of all necessary tests for passing quality purposes.
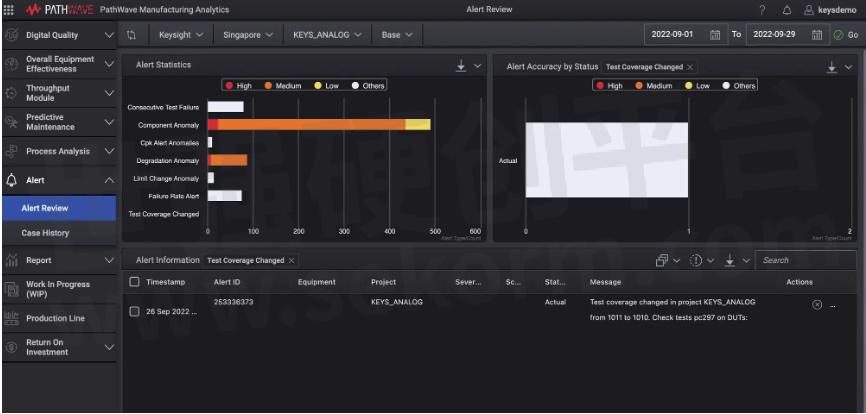
Figure 1. Test Coverage Changed Alert
Another useful feature is the Scrap Board alert, which triggers a notification when a scrap board hits the predetermined scrap threshold, as shown in Figure 2. This feature enables users to make informed decisions on cost and investigate the root cause of the scrap.
Alternatively, users can easily get the Scrap Board information by accessing the Work In Progress (WIP) module, as shown in Figure 3. This gives you an overview of the Scrap board performances of the particular site and project.
To dive deeper into the details of the scrap board, the user can click on one of the horizontal bars on the Failure Pareto by Scrap Board chart in Figure 4. By selecting p3v3_aux_gnd, for example, a Test Result Dialog box will appear, as shown in Figure 4. The user can quickly identify the scrap board(s) by looking at the blue-coded points in the Test Result chart, as shown in Figure 4. Hovering the mouse over the blue-coded points will provide historical information about the scrap board(s).
With this, users can make better decisions regarding cost and find out the root cause of scraps without halting the production line to conduct a root cause analysis.
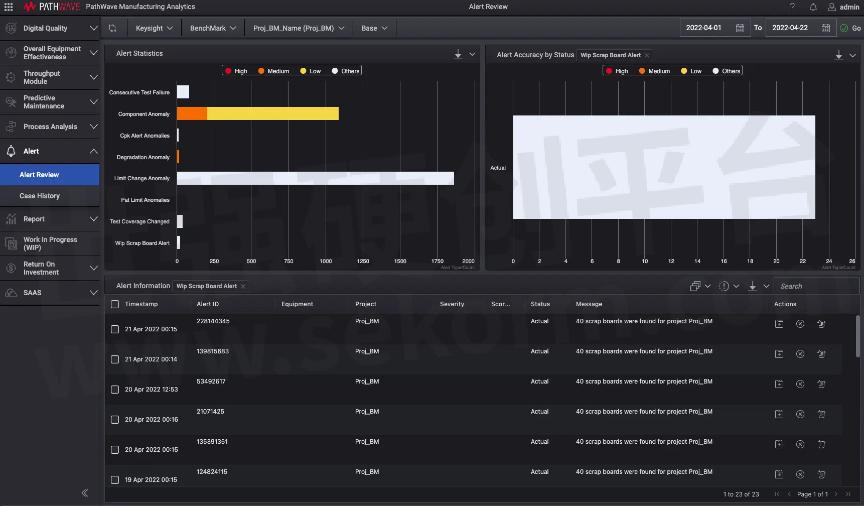
Figure 2. Alert Review – Scrap Board Alert

Figure 3. Scrap Board information in WIP (Work-In-Progress) dashboard.
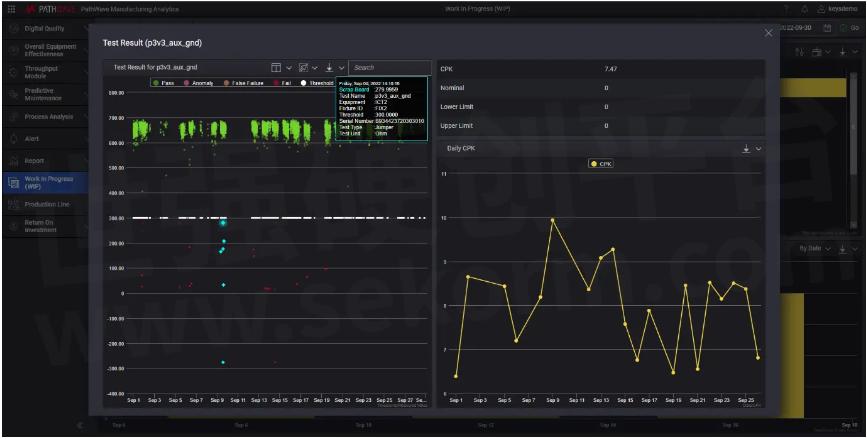
Figure 4. Test Result - p3v3_aux_gnd
Boosting your manufacturing analytics system with Keysight’s PathWave Manufacturing Analytics (PMA)
Keysight has been in the manufacturing industry for more than 30 years, and PathWave Manufacturing Analytics (PMA) has been an instrumental addition to all existing manufacturing analytics platforms. With the recently launched feature that tracks all rework and scraps, PMA has helped manufacturers globally by working alongside their existing manufacturing systems to improve their cost of poor quality and leading towards lowering the defects of the test boards.
In the world of manufacturing analytics, there is no perfect solution that provides end-to-end insights with actionable results. Each analytics provider operates in their specific area of expertise. By combining test measurement science with data science in PMA, we strive to provide our customers with visibility into their own manufacturing lines and, most importantly, to build trust between CMs and OEMs.
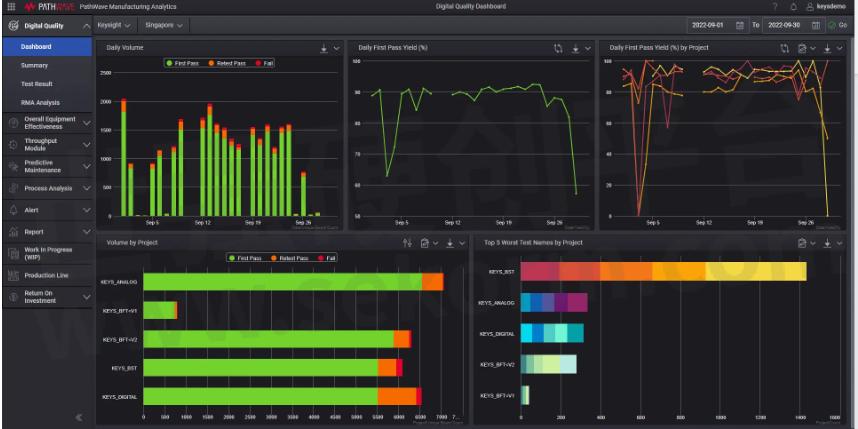
Figure 5. Digital Quality Dashboard in PathWave Manufacturing Analytics.
- +1 Like
- Add to Favorites
Recommend
- Loading data into PathWave Manufacturing Analytics
- Reducing Retest Improves First Pass Yield (FPY) with PathWave Manufacturing Analytics
- PathWave Manufacturing Analytics (PMA) Use Case: Faster diagnostics for Semiconductor recalls
- Keysight‘s Production Data Analytics Software PWA Has Supported Cloud Service Operations and Software
- Keysight i7090 with PathWave Test Executive for Manufacturing
- Testing LED using PathWave Test Executive for Manufacturing
- Keysight PathWave System Design 2023 Software Accelerates RF System Design and Digital Mission Engineering Workflows for 5G Non-Terrestrial Networks
- Keysight Introduces PathWave Design 2024 with Automation and Collaboration Support for Enterprise EDA Workflows
This document is provided by Sekorm Platform for VIP exclusive service. The copyright is owned by Sekorm. Without authorization, any medias, websites or individual are not allowed to reprint. When authorizing the reprint, the link of www.sekorm.com must be indicated.
Integrated Circuits


Discrete Components


Connectors & Structural Components


Assembly UnitModules & Accessories


Power Supplies & Power Modules


Electronic Materials


Instrumentation & Test Kit


Electrical Tools & Materials


Mechatronics


Processing & Customization