Take Advantage of Open-Source RF Analysis Toolkits

At Knowles Precision Devices, we truly do love all things RF. While we are focused on using our expertise in ceramics and thin film manufacturing to innovate on our high-performance filters, our engineers also enjoy keeping up with the trends impacting the entire RF “ecosystem.” This includes dedicating time to experimenting with various open-source RF modeling and analysis tools that we think our potential non-design engineer customers might find useful. One open-source RF and Microwave network analysis tool we have been playing around with lately that we feel does a particularly good job is scikit-rf, which is based on the Python programming language.

Based on our tinkering with this tool, we’ve put together a white paper that walks through our best practices for getting started with scikit-rf as well as a number of examples of quick filter analyses you can perform with scikit-rf. But, before getting started with scikit-rf, we recommend you have some familiarity with the Python programming language and get setup with Jupyter, and potentially even an integrated development environment, to make the programming even simpler. We also recommend using add-on tools such as Matplotlib, NumPy, and SciPy.
Once you have the configuration you feel comfortable with setup, you are ready to start experimenting with scikit-rf and performing analyses on a filter’s S-parameter file! If you have the S-parameter file stored on your computer in a location where it is easy to access from within your Jupyter setup, you can make a Network and review the Network properties. Below is the Python code we input in Jupyter to call an S-parameter file for our B095MB1S filter as well as the results.
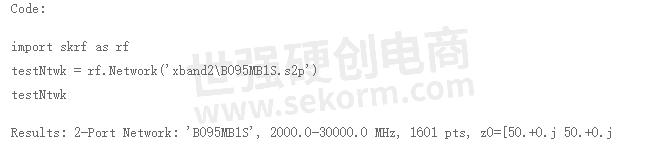
Note that in this example, the testNtwk is a Network object representing a two-port Network. The summary information in the results tells us the frequency range of this data set, the number of data points, and the impedance of the Network. The Network class also comes with convenient built-in methods for plotting and manipulating data. In this example, we can quickly plot the log-magnitude in decibels for the filter’s frequency range for four standard S-parameters by calling the plot_s_db method
![]()
Results:
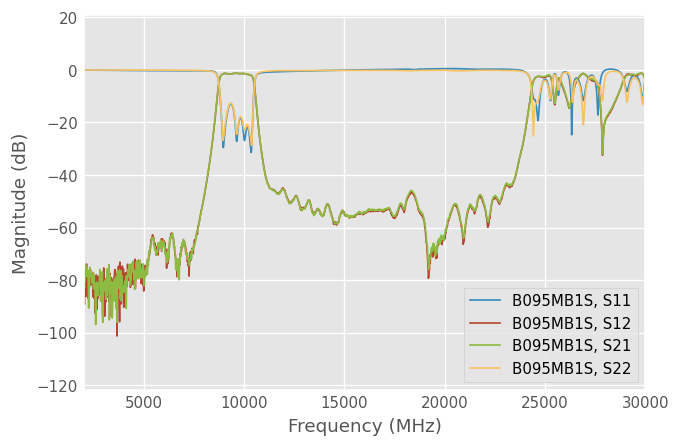
The resulting log-magnitude plot created for this bandpass filter.
In short, if you want to understand what S-parameters are telling you about a filter’s performance across frequencies, or even perform some more complex analyses, you may not need access to and training on a highly sophisticated RF modeling tool such as Sonnet, Microwave Office, or Keysight’s Genesys (now known as PathWave RF Synthesis).
To see more in-depth examples and learn more about what you can do with scikit-rf, download the full white paper, Experimenting with Open-Source RF Analysis Tools: Using scikit-rf to Evaluate Filter Performance.
Read White Paper
- +1 Like
- Add to Favorites
Recommend
- Keysight Extends Collaboration with Synopsys to Validate Complex RF and Millimeter Wave Design
- Renesas Expands RF Portfolio to Cover Complete Signal Chain for Macro Base Stations
- Differences between UART RF Module and RF Modem
- Keysight’s new software solution S8714A UXM 5G RF Application designed to simplify and accelerate RF measurements with signaling
- Common RF Antennas of Bluetooth Modules: The Ultimate Guide
- Bringing WIFI RF Front-end Chips, Low-noise Amplifiers, 5G Small Base Station RF Chips, CHIPBETTER Announced a Distribution with Sekorm
- Kinghelm RF Coaxial Connector IPEX Inner Hole KH-252515-Y2.1 Designed for Wireless Communication and RF Applications
- Knowles to Participate in Upcoming Baird Conference in New York on June 4, 2024
This document is provided by Sekorm Platform for VIP exclusive service. The copyright is owned by Sekorm. Without authorization, any medias, websites or individual are not allowed to reprint. When authorizing the reprint, the link of www.sekorm.com must be indicated.
Integrated Circuits


Discrete Components


Connectors & Structural Components


Assembly UnitModules & Accessories


Power Supplies & Power Modules


Electronic Materials


Instrumentation & Test Kit


Electrical Tools & Materials


Mechatronics


Processing & Customization