Exact Temperature Measurement in HV Connectors

The design of the HV wiring harness is an essential part for the energy efficiency of modern e-vehicles. With the help of system simulation, the conductor cross-sections in the vehicle electrical system can be optimized. This theoretical design must be validated in real operation. The combination of simulation and real testing is a promising approach.
In motor vehicles, the transmission of drive power from the energy source to the drive shaft has always been a major challenge. In internal combustion engines, the transmission of engine torque via clutch and transmission is of central importance for the reliability of the vehicle. In modern e-vehicles, the energy from the battery to the e-motor is connected via the HV onboard network. Here, the challenge lies in lightweight construction and ensuring dielectric strength. Because of its weight, the cable cross-sections must be minimized, accounting for the maximum current-carrying capacity. For this optimization measure, knowledge of the maximum local temperature is of central importance, since component reliability is inextricably linked to the local operating temperature.
Exact Measurement in HV Connectors - Paper
The design of the HV wiring harness is an essential part of the energy efficiency of modern e-vehicles. Due to its great weight, the high-voltage (HV) wiring harness offers significant savings potential for lightweight construction. With the help of system simulation, as described in the ZVEI Technical Guideline TLF0101, the conductor cross-sections in the vehicle electrical system can be optimized. This theoretical design must be validated in real operation which brings the established temperature measurement technology to its limits and shakes the principle that "the truth lies in the laboratory". The combination of simulation and real testing is a promising approach that also opens the possibility of re-evaluating the established safety factors.
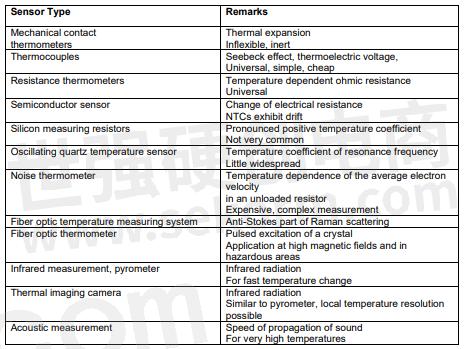
In motor vehicles, the transmission of drive power from the energy source to the drive shaft has always been a major challenge. In internal combustion engines, the transmission of engine torque via clutch and transmission is of central importance for the reliability of the vehicle. In modern e-vehicles, the energy from the battery to the e-motor is connected via the HV onboard network. Here, the challenge lies in lightweight construction and ensuring dielectric strength. Because of its weight, the cable cross-sections must be minimized, accounting for the maximum current-carrying capacity. For this optimization measure, knowledge of the maximum local temperature is of central importance, since component reliability is inextricably linked to the local operating temperature. The measurement of the temperature hotspot starts with the selection of the measurement method. Table 1 shows an overview of possible methods for temperature measurement. In practice, the use of thermocouples has become established for this purpose because of their price and their simple and flexible handling. The next step is to determine the location of the hotspot. This can be determined by thermography on exposed inner conductors or with the help of a system simulation. To measure the hotspot, the sensor must be placed at the hottest point. If this is not possible due to constructional conditions, the sensor may be mounted near the hotspot according to DIN EN 60512-5-2. In addition to the measurement location, the installation position of the sensor also has an influence on the measured temperature.
Table 1 Overview of temperature measurement methods
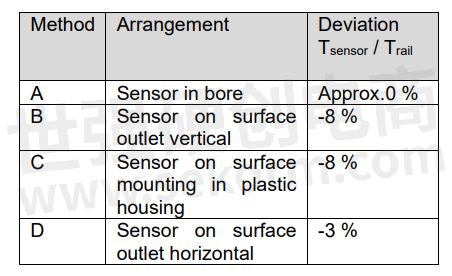
Assessment of Typical Measurement Deviation In order to quantify this influence of the sensor arrangement, a 3D FE model was set up. For this purpose, a 100 mm² copper bar was modeled with the usual arrangements for temperature measurement in the HV connector (see Table 2). The temperature-dependent electrical resistance of copper is accounted for in the model. Natural convection and radiation were stored based on the VDI heat atlas. The temperature distribution was calculated with 600 A for the steady-state load case (Figure 1) and 800 A for the transient load case (Figure 2).
Table 1 Sensor arrangements
The temperature distribution in the sensor area (Figure 1) reveals the sensitivity of the temperature measurement in relation to the sensor arrangement. The sensor in bore (A) measures the actual rail temperature very accurately. The measurement with arrangements B and C results in a temperature that is 10 °C too low.
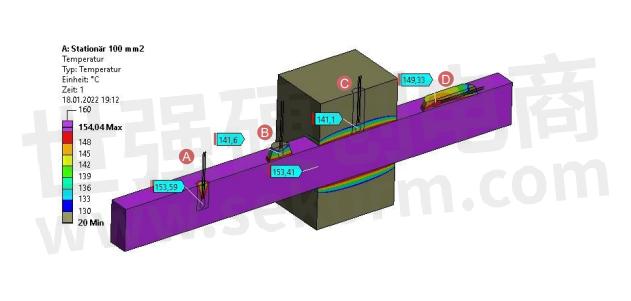
Figure 1 Influence of the sensor mounting position on the measured temperature at 600 A continuous current
The transient temperature curve in Figure 2 reveals another crucial factor in temperature measurement. The solid lines show the transient temperature curve at 800 A. The deviation of the sensor temperature from the rail temperature is shown in dotted lines. The time course of the deviation shows that the sensor arrangement has a significant influence on the response time of the sensor. For example, sensor arrangement A shows the temperature with an error of < 10% after 10 s, while arrangement C has a deviation of 15% from the actual rail temperature, even after 600 s. The deviation of the sensor arrangement C from the actual rail temperature can be significant. This delay can lead to misestimation of the current carrying capacity of a component in transient current profiles.
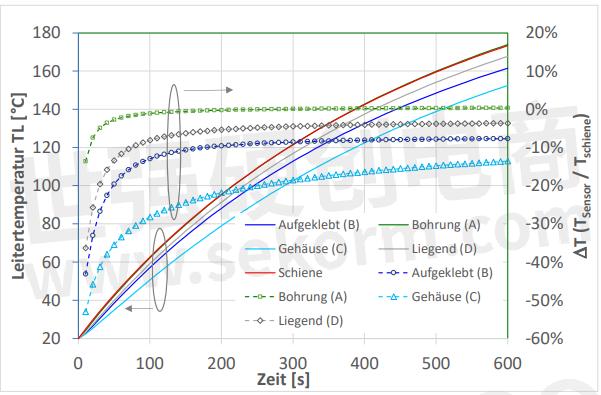
Figure 2 Transient temperature profile from switch-on at 800A.
The theoretical consideration of the sensor arrangement was verified for the described application with the aid of a laboratory experiment. For this purpose, a copper bar with a crosssection of 100 mm² was also prepared with the sensor arrangements A, B, and D. A thermocouple was inserted on one side. A thermocouple type K was attached to one side and an NTC sensor to the opposite side to additionally compare the sensor type. The actual rail temperature is determined by a voltage tap.
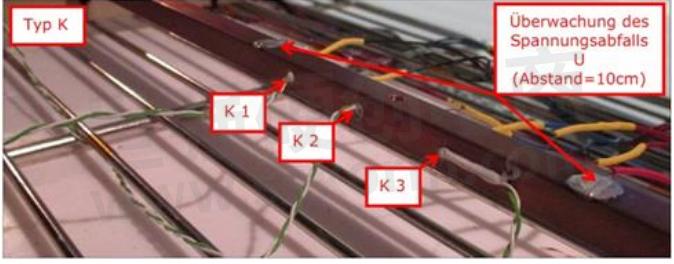
Figure 3 Copper bar with sensors, 100 mm² bar cross-section.
In [1] This experiment is described and evaluated in detail. The authors show that the deviations described in the FE simulation are actually exceeded due to further uncertainties such as the amount of adhesive used on the sensor. In the test shown in Figure 3, a deviation of up to 25% compared to the actual temperature was demonstrated.
Effect on the Design of the On-Board Power Supply System Measurement deviations and tolerance influences are considered during product development by means of safety factors. These safety factors lead to a planned over-dimensioning to safeguard against the possible overload caused, for example, by an inaccurately determined measured variable. If the measurement deviation can be reduced or calculated back to the true value, the safety factor can be reduced.
Figure 4 shows the measurement situation on a real connector (ROSENBERGER HPK angle connector). The curve shown in black shows the temperature curve of the coupler inner conductor, which according to the hotspot analysis represents the best possible measurement position for the hotspot temperature measurement. This temperature is measured with method A. The violet curve shows the temperature curve if method C is to be used for measurement. This results in a difference of 6 K. The measurement deviation due to measurement method C can be determined with the help of a system simulation according to the procedure in [2]. For this purpose, the simulation parameter must be determined with 3D FE analyses and the system simulation thus created must be matched with the laboratory measurement. Once the alignment is achieved (Figure 4, simulation vs. coupler IL), the real conductor temperature can be determined using the simulation. Therefore, the measurement deviation based on measurement method C can be completely back-calculated. Furthermore, this precise simulation model gives the possibility to calculate the spring temperature, which is no longer possible via the measurement technique. Figure 4 shows the spring temperature in green. This curve shows a temperature up to 8 K higher than the inner conductor and follows the underlying current profile very dynamically. Effect on the design of the onboard power supply system.
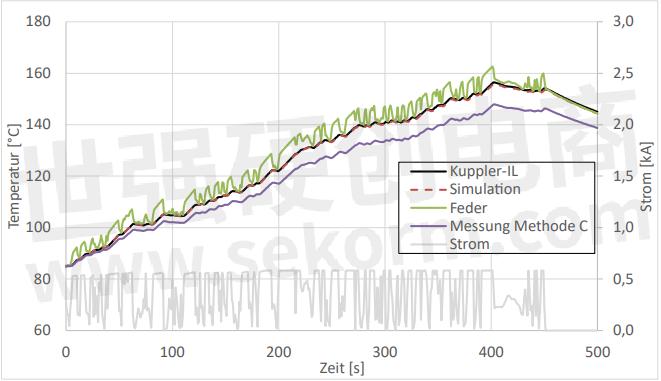
Figure 4 Transient measurement and calculation results of a balanced system simulation using the example of the HPK right-angle plug.
In order to reliably compensate for the difficulties arising from measurement technology, Rosenberger has the issue by embedding the above approach in its in-house standard. [1] describes the essential framework conditions for a reliable simulation model.
Summary and Outlook
The correct measurement of temperatures in high-voltage connectors is sometimes very
challenging. This challenge can be solved by the coupled use of simulation and measurement.
By consistently implementing this approach, the current HV products from Rosenberger
support lightweight construction in the development of vehicle electrical systems. These
products offer the required performance with optimized cross-sections and unchanged high
reliability.
SOURCES
[1] C. Dandl, S. Thies, H. Edfelder, Advantages of virtual parameter determination of connectors for electro-thermal HV on-board power system simulation, 26th Symposium AlbertKeil-Seminar 20222.
[2] ZVEI Guideline TLF0101
AUTHORS


- +1 Like
- Add to Favorites
Recommend
- ITT EV connector can be used for Electric eVTOLs to be recharged quickly and efficiently on the ground
- The Difference between FFC Connectors and FPC Connectors
- The Development of High-Voltage Connectors
- DIN EN 1100 Certified WSMP® Coaxial Connectors, 45% Smaller than Standard SMP Connectors
- What is the Role of Industrial Connectors? What Types of Industrial Connectors Can Be Divided into?
- Standex-meder SIL HV Series High Voltage/High Current Reed Relays which is Smallest with 4kVDC Voltage Hold-off
- ept Colibri® 0.5 mm-pitch SMT Connectors Colibri® 0.5 mm-Pitch SMT Connectors: Maximum Flexibility with Data Transfer Rates of Up to 16 Gbps
- RJ45 Connector for PoE+ Cabling Solution Can Provide up to 90W of Power Supply | Rosenberger
This document is provided by Sekorm Platform for VIP exclusive service. The copyright is owned by Sekorm. Without authorization, any medias, websites or individual are not allowed to reprint. When authorizing the reprint, the link of www.sekorm.com must be indicated.
Integrated Circuits


Discrete Components


Connectors & Structural Components


Assembly UnitModules & Accessories


Power Supplies & Power Modules


Electronic Materials


Instrumentation & Test Kit


Electrical Tools & Materials


Mechatronics


Processing & Customization