Optimize Signal Quality In 5G Private Network Base Stations
With the rapid evolution of cellular communication systems, there is a growing need for higher operating frequencies and wider bandwidths to support next-generation wireless standards. The Internet of Things (IoT), autonomous vehicles, wireless broadband, interruption-free video, and the fourth industrial revolution will all benefit from 5G.
Over the next decade, thousands of companies will likely deploy private cellular networks. Enterprises can harness the advantages of 5G private networks for businesses with support from the Third Generation Partnership Project (3GPP) standards and more. In order to provide comprehensive coverage of 5G new radio (NR) private network, 5G NR measurement applications running on a signal analyzer should be able to measure and interpret transmitter tests. Some key tests include output power, output power dynamics, transmit ON / OFF the power, transmit signal quality, unwanted emissions, and transmitter intermodulation. Therefore, it is essential to select testing devices that can provide robust performance, and ensure that the base station transmitters in the network perform to standards.
To characterize and test millimeter-wave (mmWave) products’ true performance, designers and manufacturers need to address testing challenges that make the signal quality more susceptible to impairments. Error vector magnitude (EVM) measurement offers powerful insight into the performance of a digital communication base station transmitter and is one
of the primary metrics to assess the quality of the transmitted signal.
This white paper will discuss the EVM measurement as a key component of transmit signal quality in 5G private network base stations, the testing challenges that mmWave poses, and the Keysight solutions that address these challenges.
The Main Use Cases for 5G NR
In fact, Rel-16 includes several capabilities designed specifically for industrial environments, such as the ability to replace Ethernet, Wi-Fi, and LTE networks. 5G is well-suited for industrial environments. The three main use cases for 5G NR are enhanced mobile broadband (eMBB), massive machine-to-machine communications (mMTC), and ultra-reliable low-latency communications (URLLC).
eMBB
When discussing 5G eMBB, we are referring to the target peak and average data rates, capacity, and coverage of 5G compared to conventional mobile broadband. It specifies a 5G design with downlink (DL) speeds of up to 20 gigabits per second (Gbps) and uplink (UL) speeds of 10 Gbps.
mMTC
The mMTC network can support 5G IoT solutions with billions of sensors and connected devices, as well as devices with low data rates / low bandwidth that require long battery life. This category also includes high-bandwidth / high data rate devices.
URLLC
Applications in the URLLC segment require fail-safe communication; these applications include autonomous vehicles, smart transportation networks, and the industrial internet. Rel-16 also includes time-sensitive networking (TSN), a vital feature for the coexistence of ethernet and 5G networks in factories and other areas where private networks are prevalent. Rel-16 also includes support for unlicensed spectrum which could help 5G deployments in the private sector.
The Rise of 5G Private Networks
In the coming years, the wireless communications segment will expand significantly as 5G private networks come into existence. This includes taking advantage of higher frequency and wider bandwidth applications. 5G NR operates in two frequency ranges (FR): FR1 operates in the sub-6 GHz band and FR2 in the mmWave band. The maximum channel bandwidth goes up to 100 MHz for FR1 and 400 MHz for FR2. The mmWave spectrum is faster and has lower latency. In addition, its signals are easier to contain inside buildings, so they are less likely to interfere with macro mobile networks. However, testing is complicated due to the range of frequencies, bandwidths, and deployment modes that devices and networks support. In conjunction with 5G NR, private base stations (BS) can support connectivity for different spectrum bands (sub-GHz, 1 to 6 GHz, or mmWave). The 5G base station products must pass all of the test requirements prior to their release. Otherwise, the products are not 3GPP-compatible or appropriate to implement in a network.
Testing Challenges
3GPP defines the radio frequency (RF) conformance test methods and requirements for NR base stations in the technical specifications. TS 38.141-1 (conducted conformance testing) and TS 38.141-2 (radiated conformance testing) specify the radio frequency conformance test methods and requirements for NR base stations in both FR1 and FR2. Chapter 6 of these specifications lays out the requirements for transmission tests for the base station transmitters (Tx).
You can define four types of base station configurations according to 3GPP, depending on the conducted or radiated type of the test. Type 1-C refers to the NR base station operating at FR1 with requirements defined at individual antenna connectors. Type 1-H refers to the NR base station operating at FR1 with requirements defined at individual transceiver array boundary (TAB) connectors, and over-the-air (OTA) requirements defined at the radiated interface boundary (RIB). Type 1-O and Type 2-O refer to NR base stations operating at FR1 or FR2 with a requirement set consisting only of OTA defined at the RIB.
In general, the main difference between conducted and radiated tests is the radiated tests for BS types 1-H, 1-O, and 2-O.
At mmWave frequencies and wider bandwidths, the signal quality is more susceptible to impairments. To characterize and test the true performance of mmWave products, designers and manufacturers need to address testing challenges in these situations. An EVM measurement can offer powerful insight into the performance of a digital communication base station transmitter and can detect any flaw affecting the magnitude and phase trajectory of a signal, regardless of the modulation format. In 3GPP standards, EVM measurement is one of the primary metrics to assess the quality of the base station transmitted signal from the base station.
1. Characterizing mmWave Signal Quality: EVM
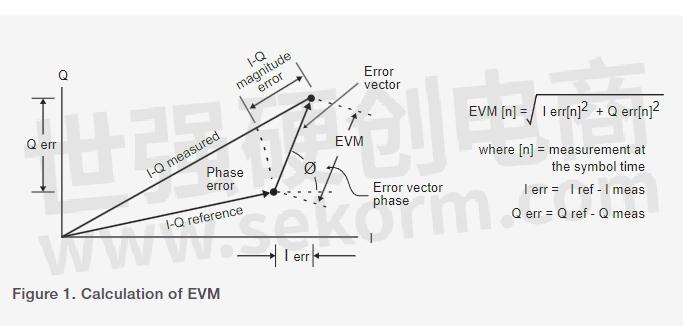
EVM is the most common metric for evaluating modulation quality in digital communications. The error vector is the vector difference between the I-Q reference signal and the measured signal at a given time. The error vector is a complex quantity with a magnitude and phase component.
EVM is the root mean square (RMS) of the error vector over time at the instant of the symbol clock transition. You can normalize EVM either by the amplitude of the outermost symbol or by the square root of the average symbol power. EVM measurement is sensitive to any signal impairment affecting the magnitude and phase trajectory of a signal for any digital modulation format. Therefore, EVM is an ideal tool for diagnosing problems in the baseband, the IF, or the RF sections of a communication system. In Figure 1, you can see the calculation of the error vector as a vector difference between an ideal reference signal and a measured signal at a given time.
Signal Quality
Many factors influence the quality of a signal, including baseband signal processing, modulation, filtering, and up-conversion. At mmWave frequencies and wide bandwidths, signal impairments can pose more of a problem. Orthogonal properties in orthogonal frequency-division multiplexing (OFDM) systems prevent interference between overlapping carriers. However, impairments such as in-phase and quadrature (I-Q) impairments, phase noise, linear compression (AM to AM), and nonlinear compression (AM to PM), as well as frequency errors distort the modulated signal.
Phase noise poses one of the greatest challenges to mmWave OFDM systems, since each subcarrier interferes with the other, resulting in impaired demodulation. To avoid these impacts on design performance, device designers need to overcome the physical challenges present in wide bandwidth and mmWave signals. Measurement and characterization of signal quality require test solutions with better performance than the device under test (DUT) without introducing new issues. You can see some examples of I-Q modulation impairments that cause constellation symbols to deviate from their defined locations in Figure 2. These deviations provide information about the nature of the impairments based on the type and intensity of deviations.
These factors combine into a single plot by considering the EVM contribution to each impairment as well as the output power. For example, you can achieve an EVM bathtub curve for a system based on its operating level. On low operating power levels, noise performance dominates the EVM performance and on high operating levels, non-linearity is dominant. Typically, you can define the lowest EVM level for a system by the aggregation of all the error sources, including phase noise.
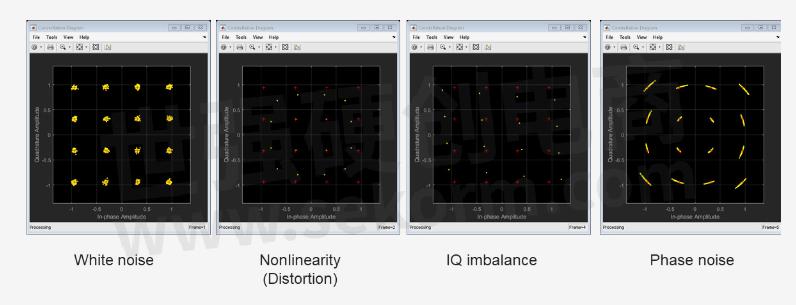
Figure 2. Examples of I-Q modulation impairments that cause deviation for constellation symbols
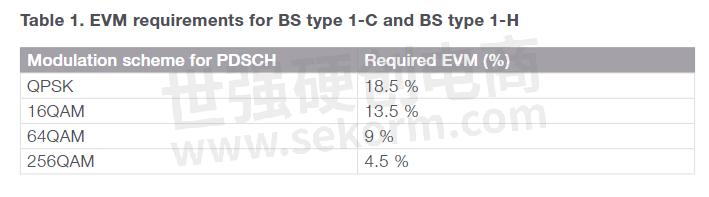
EVM measurements during conformance testing verify that modulation quality is within the limits specified by the minimum requirements. Antenna connectors and TAB connectors must meet the minimum requirements when testing one at a time or in parallel. You must repeat tests for all antenna connectors and TAB connectors. EVM for NR carriers of different modulation schemes on physical data shared channel (PDSCH) must be less than the limits appearing in Table 1. It is necessary to perform EVM measurements for all bandwidths on all allocated resource blocks and downlink slots within 10 ms measurement periods.
OTA modulation quality requirement for radiated conformance testing is a directional requirement at the RIB that one needs to ensure is within the OTA coverage range. The purpose of the test is to ensure that OTA modulation quality is within the minimum requirements.
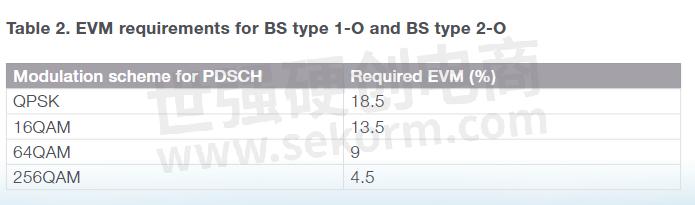
The EVM of each NR carrier for BS types 1-O and 2-O must not exceed the limits in Table 2 for different modulation schemes on PDSCH. For NR, for all bandwidths, you need to perform the EVM measurement for each NR carrier over all allocated resource blocks and downlink slots within 10 ms measurement periods.
2. Challenges in Testing at High Frequencies and Wide Bandwidths
Excessive path loss poses a major challenge in mmWave frequencies. The components of mmWave devices are compact and highly integrated with no places to probe. In contrast to traditional cable tests, this situation results in the need for radiated tests or OTA tests. But OTA tests present their own set of challenges including path loss.
Confronting Path Loss
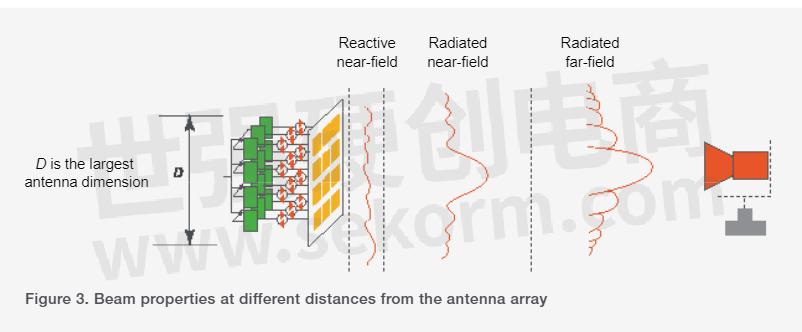
It is possible to perform OTA tests for either the near-field or far-field. While near-field measurements may be appropriate for some applications, 5G cellular communication requires far-field assumptions. The far-field distance and path loss associated with radiated waves increase with frequency due to the nature of the waves. The characteristics of these signals change as they propagate from antenna arrays and become more developed (Figure 3). With an LTE 15 cm device operating at 2 GHz frequency, for example, the far-field region begins at 0.3 meters and has a 28 dB path loss. However, for a 5G NR device of the same size operating at 28 GHz, the far-field region starts at 4.2 meters and the path loss is 73 dB. So when you increase the frequency, the path loss increases.
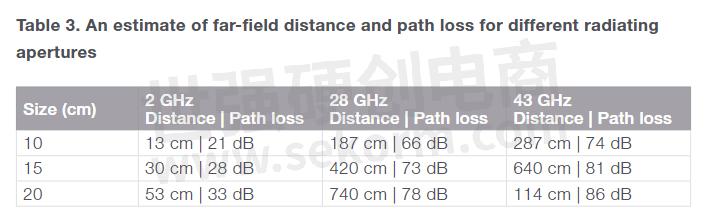
You can get a better idea of path loss by looking at Table 3 below. The greater the path loss and the larger the distance between the DUT and the probe antenna, the more challenging the test will be. For an antenna size of 10 cm, the path loss difference between 2 GHz and 28 GHz can be up to 45 dB. The difference between 2 GHz and 43 GHz is 53 dB (Table 3).
Due to the excess path loss, getting accurate OTA measurements is challenging using mmWave devices. Because of the excessive path loss between instruments and DUTs, signal analysis measurement becomes more challenging due to the low signal-to-noise ratio (SNR). Low SNR degrades base station transmitter measurements, such as EVM and adjacent channel leakage ratios (ACLR), and misrepresents the performance of the DUTs. Additionally, analyzing wide bandwidth signals at mmWave frequencies involves overcoming the effects of frequency response, which degrades the quality of the signal further. Therefore, 5G private networks require engineers to rethink their design and testing processes.
Measurement Uncertainties
In addition, wideband noise complicates mmWave testing which adds to measurement uncertainties and complexity. With mmWave, you will be able to achieve higher frequency; wider bandwidth; lower latency; higher data throughput, resolution, and accuracy; and higher-order modulation schemes for faster data rates. However, mmWave also introduces more noise. In other words, to achieve greater sensitivity at a receiver, a transmit signal must compete with the channel’s noise floor.
Using the Shannon-Hartley theorem, we can gain insight into the maximum transmission rate over a communication channel with noise within a certain bandwidth. Increased bandwidth increases the rate of the signal transmission over a channel with a bandwidth of B to reach the receiver, but it also introduces more noise into the signal analyzer. The upshot is that greater bandwidth reduces the SNR and makes achieving accurate mmWave measurements more difficult. Consequently, mmWave devices and components require careful evaluation.
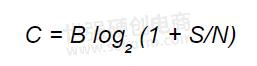
Where C is the channel capacity in bits per second (bit/s), B is the signal bandwidth in Hz, S is the average received power over the bandwidth in watts, and N is the average power of the noise over the bandwidth in watts.
Frequency Responses
Testing mmWave also faces the challenge of frequency responses. A test system's cables, connectors, switches, and fixtures can impact frequency response in the path between the signal analyzer and the DUT. These responses consist of different frequencies and include amplitude and phase errors which degrade measurement accuracy. When you test 5G NR FR2 signals with a wider bandwidth and higher frequency, the frequency response becomes worse.
Because the primary objective of a test system is to characterize a DUT, you need to extend the measurement accuracy from a signal analyzer's input port (reference plane) to the DUT's test port (test plane). Then you must ensure that the system isolates the DUT's measured results from the effects of other test segments.
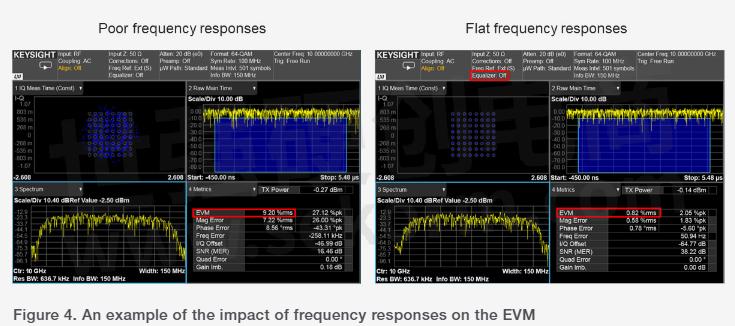
Figure 4 shows a 64 QAM modulation signal at a 100 MHz symbol rate and carrier frequency at 10 GHz measured by a signal analyzer at the DUT’s input port. Test system components contribute to frequency responses, including phase and amplitude responses which affect modulation quality. Due to these frequency responses, the I-Q constellation (upper left) on the left panel is chaotic, and it is not possible to demodulate the signal. Therefore, you need to minimize these frequency responses to improve the accuracy of the measurement between the test plane and the reference plane. Minimizing the frequency responses will help you produce more accurate measurements (see Figure 4, right panel).
3. Tips for Optimizing EVM Measurements
A signal analyzer can incorporate attenuation at high-power levels or use a pre-amplifier at low-power levels in order to measure the variety of input signals. In general, signal analyzers provide several RF signal paths, such as a default path, a microwave pre-selector bypass, a low-noise path, and a full-bypass path to reduce noise, and therefore, improve sensitivity and SNR. Full bypass reduces path loss, signal fidelity, and measurement sensitivity while avoiding multiple switches in the low-band switch circuitry and bypassing the microwave pre-selectors. MmWave full bypass paths have up to 10 dB less loss, improve SNR, and enable you to produce more accurate EVM measurements.
Getting to Higher Frequency Safely
Wireless standards specify transmitter measurements at maximum output power. The first mixer of a signal analyzer attenuates the input power level to protect the analyzer from input signal distortion. The input signal level can appear below the mixer's optimal level in certain scenarios, such as OTA tests and testing systems with huge insertion losses. Integrated pre-amplifiers can provide a lower noise figure, but they have a lower intermodulation distortion-to-noise-floor dynamic range. It is important to find the right input mixer level that balances distortion performance with noise sensitivity. A higher input
mixer level can improve SNR, whereas a lower input mixer level can reduce distortion.
It is also very important to keep the path loss between the DUT and signal analyzer as low as possible when building a mmWave test system. Using an external mixer can minimize path loss by enabling you to move the test port close to the DUT, thereby shortening the mmWave signal path and enhancing SNR. However, due to the fact that there is no pre-selector at the front of the mixer, strong out-of-band signals can cause some unwanted images to appear in the band of interest, thus reducing measurement accuracy.
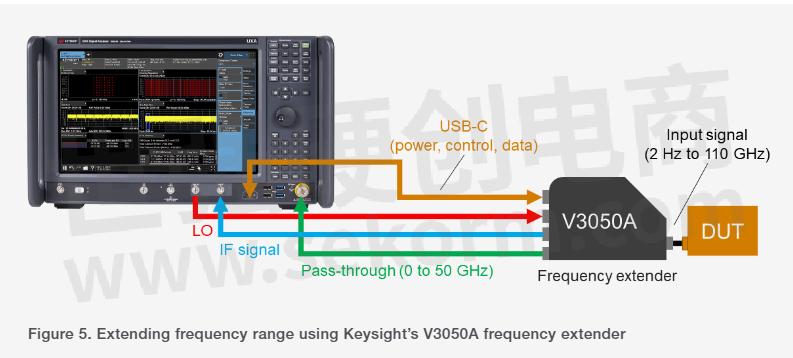
External Frequency Extender
On Keysight's V3050A advanced external frequency extender, a pre-selector and an RF switch combine to provide swept power spectrum between 2 Hz and 110 GHz that is unbanded and pre-selected. As a result, the V3050A solution features excellent sensitivity and the deepest dynamic range (Figure 5).
The phase noise performance of a signal analyzer can also affect EVM measurements. In 5G NR, data transmit in parallel using OFDM, a modulation scheme that uses many closely spaced orthogonal subcarrier signals, each with a different modulation scheme. If the local oscillator (LO) of a signal analyzer has poor phase noise, the subcarrier with phase noise interferes with other subcarriers, lowering modulation quality. There are several methods for phase noise optimization with signal analyzers including best close-in, best wide-offset, and fast tuning. Signal analysis for modulation analysis requires not only consideration of the phase noise profile of the signal analyzer, but also its operating frequency, bandwidth, and subcarrier spacing.
A signal analyzer's specifications are usually valid up to the instrument's input connectors, where the instrument sets the reference plane. It is important to take into account the impact of the components outside the test instrument in the path between the instrument and the DUT. These components can contribute to the degraded measurement accuracy of systems by adding to frequency responses. RF engineers should look for new and better ways to minimize frequency response errors in wide bandwidths and high frequencies such as mmWaves and beyond.
The Keysight U9361 RCal receiver calibrator operates by moving the reference plane to the DUT to calibrate the system. Data automatically transfer from the memory to the signal analyzer and the analyzer detects it easily. By using this setup, you can reduce the effort and complexity of calibrating your test receiver system up to 110 GHz.
4, Keysight’s Signal Analysis Solutions
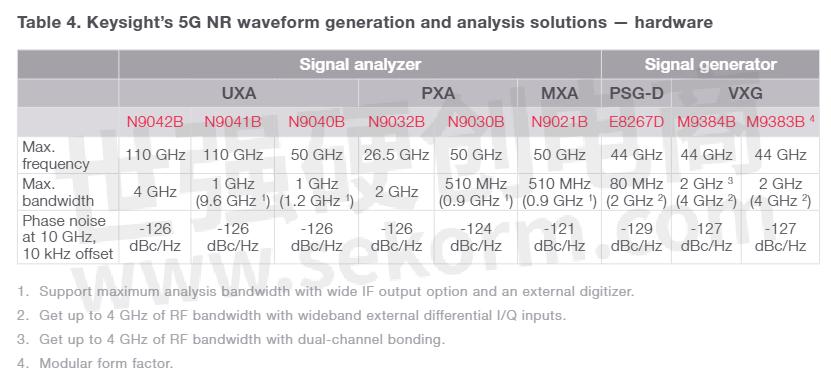
A low-noise amplifier (LNA) at the front-end of the signal analyzer reduces the system noise figure with, or without the internal preamplifier to optimize the mixer's input level (Figure 6). Both Keysight’s N9042B UXA X-Series and N9032B PXA XSeries signal analyzers feature integrated LNA and preamplifiers for various test scenarios. The two-stage gain optimizes the measurements at low input levels to reduce the noise and provide the best performance while balancing noise and distortion. N9032B is an ideal solution for FR1 applications, and N9042B covers frequency ranges for both FR1 and FR2 applications.
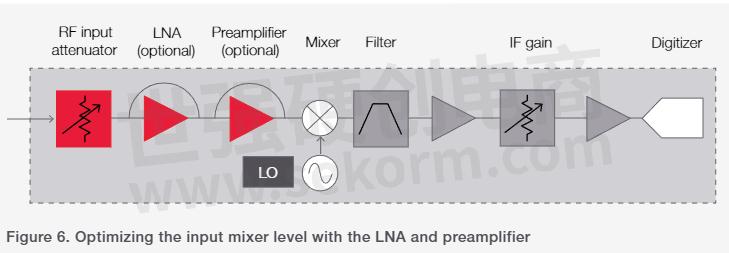
Figure 7 shows an example of the noise floor of a signal analyzer ranging from 2 Hz to 50 GHz. Turning the preamplifier on lowers the noise floor by around 20 dB. By switching on both the preamplifier and LNA, you will be able to lower the noise floor even further.
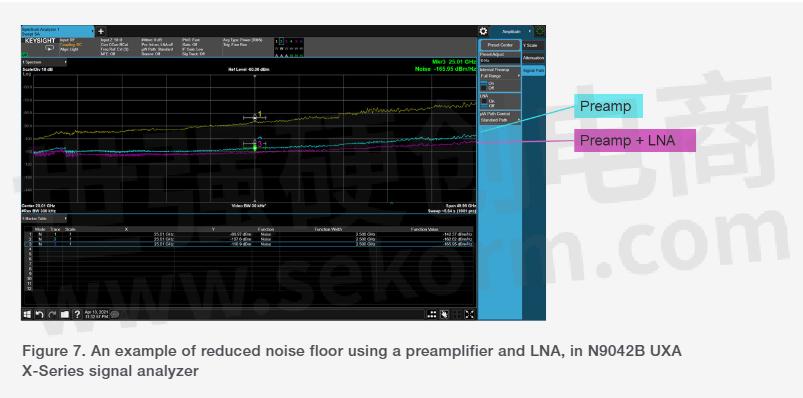
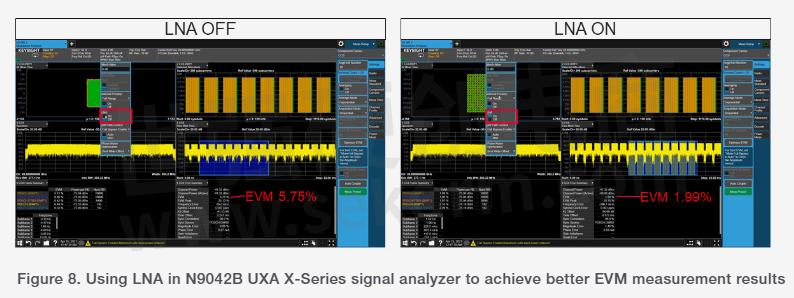
Figure 8 shows an example of 5G demodulation where the input power is -40 dBm and below the signal analyzer's best mixer input level. Here, the attenuator is set to 0 dB, and the signal path is a full bypass. Even after minimizing all path losses for the signal analyzer, the EVM does not perform as expected. Turning the LNA on (right) improves the EVM significantly, enabling it to go from 5.75% to 1.99%.
Keysight's N9042B UXA X-Series signal analyzer offers wide analysis bandwidth and the deepest dynamic range for complex mmWave analysis in 5G private network applications. In mmWave frequencies, signal quality is more susceptible to distortion,
phase noise, and modulation errors. The N9042B UXA X-Series signal analyzer and the frequency extender enable new levels of performance for high-frequency measurements, including covering the current 5G NR FR1 and FR2 bands and beyond, up to 110 GHz.
An entirely new front-end design provides low noise performance and high dynamic range. The design also addresses applications in base station transmitter tests, such as EVM and other modulation quality tests while continuing to perform low-level measurements on unknown signals. The N9042B supports the PathWave X-Series family of multi-touch applications, as well as the PathWave vector signal analysis (89600 VSA) software. A new CPU performs compute-intensive measurements, such as demodulation and EVM, up to 40% faster than prior analyzers.
Similarly, Keysight’s N9032B PXA X-Series signal analyzer delivers the widest analysis bandwidth in its class, as well as unparalleled performance to meet your requirements for lower frequency wide bandwidth analysis. The N9032B offers up to 2 GHz of bandwidth, or four times more bandwidth for all frequencies of 8.4, 13.6, and 26.5 GHz. The N9032B analyzer features the same LNA and preamplifier as the UXA family and offers optimal displayed average noise level (DANL), EVM residuals, and sensitivity in its class.
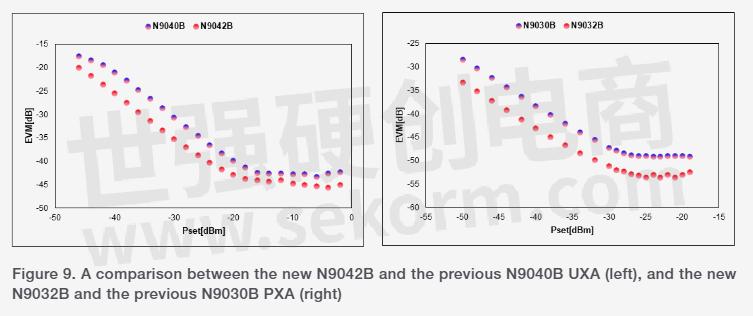
Using Keysight’s U9361 RCal calibrator, you can compensate for path losses and improve accuracy by an order of magnitude. With the N9032B, you get all the functionality of a 6U-high signal analyzer, but in a compact 4U-high package. As a result of its compact design, it is easy to replace legacy rack-mounted spectrum analyzers to save space. The front-end LNA improves DANL for N9032B by 3-7 dB, compared to the N9030B and N9040B. Figure 9 shows a comparison between the new N9042B and the previous N9040B UXA, as well as the new N9032B and the previous N9030B PXA.
There are a variety of options to meet any 5G private network requirement with Keysight's signal analyzer portfolio. Using the N9032B and N9042B, you can perform the most accurate signal analysis for FR1 and FR2 applications. In addition, the RCal receiver calibrator, the VXG Signal Generator, and Keysight's industry-leading measurement software applications offer a comprehensive solution for your 5G private network base station transmitter conformance with a wide range of compliance regulations.
- +1 Like
- Add to Favorites
Recommend
- Keysight Technologies Acquires Quantum Benchmar, Augmenting Keysight‘s Quantum Portfolio
- Keysight First to Gain OmniAir Qualified Test Equipment Status, Accelerating C-V2X Device Certification
- Keysight First to Gain GCF Approval of Cases for Validating 5G New Radio mmWave Devices in Standalone Mode
- Keysight Massively Parallel Board Test System Selected by LACROIX in Automotive Printed Circuit Board Manufacturing
- Keysight, TIM and JMA Wireless Join Forces to Showcase O-RAN Technology at Mobile World Congress 2021
- Keysight, Xilinx and Cisco Showcase Solutions that Support Smooth Migration from 4G LTE Networks to 5G Open RAN
- Keysight Unveils the First Media Access Control Security Test Solution for High Speed Ethernet
- Keysight, MediaTek Join Forces to Establish 5G Connectivity Based on 3GPP Release 16 Specifications
This document is provided by Sekorm Platform for VIP exclusive service. The copyright is owned by Sekorm. Without authorization, any medias, websites or individual are not allowed to reprint. When authorizing the reprint, the link of www.sekorm.com must be indicated.
Integrated Circuits


Discrete Components


Connectors & Structural Components


Assembly UnitModules & Accessories


Power Supplies & Power Modules


Electronic Materials


Instrumentation & Test Kit


Electrical Tools & Materials


Mechatronics


Processing & Customization