How Over-provisioning Improves NAND-based ATP SSDs’Endurance and Performance

Abstract
Over-provisioning (OP) provides additional space for garbage collection process of solid-state drives (SSDs), aids in improving the performance, and increases their endurance, hence contributing to extended drive life. This article provides an in-depth view of OP and how its size affects the terabytes written (TBW), along with random write performance of SSDs.
Introduction to Over-Provisioning
In the past few decades, flash-based SSDs have sparked a revolution in storage devices. Unlike traditional electro-mechanical hard disk drives (HDDs) that use magnetic disks for storage, SSDs are made from an array of solid-state electronic storage chips, consisting of control units and storage cells (i.e., NAND flash chips, DRAM chips), thereby offering higher data transfer rates, area storage density, and reliability, as well as lower latency and access times.
In the scope of this article, it is worth elaborating the function of HDDs and SSDs. While the HDDs write and overwrite data by magnetizing sectors on the magnetic disks, the data on SSDs cannot be overwritten directly. Instead of overwriting old data, SSDs update data by programing, in the NAND flash, a new copy and invalidating previous copy of the same data.
Key and fundamental operations allowing to write data in the NAND flash are Program (P) and Erase (E). One P and E process is called one P/E cycle. The number of P/E cycles is used to describe the NAND flash endurance. Since every P/E cycle will lead to slight wear to the flash, NAND flash has finite P/E cycles before it is worn out. Various techniques and algorithms are implemented to manage the NAND to extend the lifespan of SSDs. The OP is one of them and is the focus of this article. It is actually a feature closely related to the working principle of NAND-based SSD storage.
It is important to have some basic knowledge regarding the physical structure of NAND memory to understand the P and E processes of SSDs. The NAND memory can be divided into blocks. One block usually consists of many pages and the page size varies with the NAND technology. In a programing process, data can only be written into one page at a time. However, Erase happens only to one block. Due to this limitation, a Garbage Collection process has been introduced to make full use of the flash memory.
Garbage Collection (GC)
The SSD controller uses Flash Translation Layer (FTL) to manage the mapping of the logical block address (LBA) from the host space and physical block addresses (PBA) of the flash memory. This mapping is in the form of a linking/mapping table. The Host addresses the physical blocks by using the linking table.
To clarify the GC process in simple terms, a flash memory is simplified into two physical blocks, each containing six pages, as shown in Figure 1. When writing the data to memory, with the help of wear-leveling algorithm, the data is distributed fairly evenly across all physical blocks as shown in Figure1(a), thus preventing repeated programming on specific areas. Since it is not possible to directly overwrite data on flash, the updated data needs to be written to free pages, while the original data is marked as invalid, as shown in Figure 1(b). The FTL will simply redirect the logical addresses of the updated data to the new physical addresses.
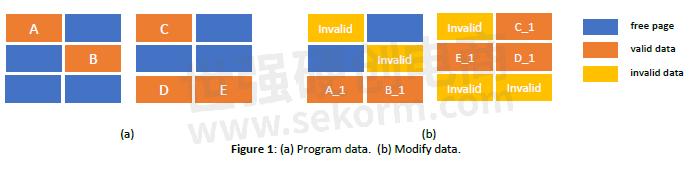
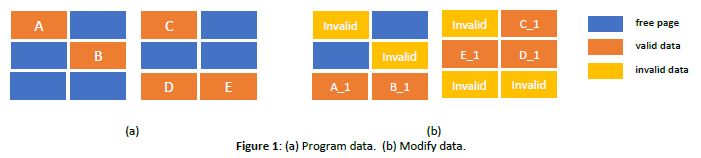
Invalid pages need to be freed up to allow more data to be added to the memory. Given the fact that erase can only be done at the block level to free the invalid pages in the blocks above, the valid data need to be read and written to free pages in another block. At the same time, the data in original pages are marked as invalid and the whole block containing only invalid data can be erased. The process of collecting valid data and erasing entire blocks of invalid data is called GC.
as shown in Figure 2.

Write Amplification Factor (WAF)
Suppose the Host wants to write data while there are very few free blocks available in the SSD, the SSD controller should start performing the GC process to free up the blocks containing invalid data. As shown in Figure 3, during the “GC – Write data” process, the SSD actually wrote four pages to the flash, in order to write data “F” on one page, as requested by the Host.

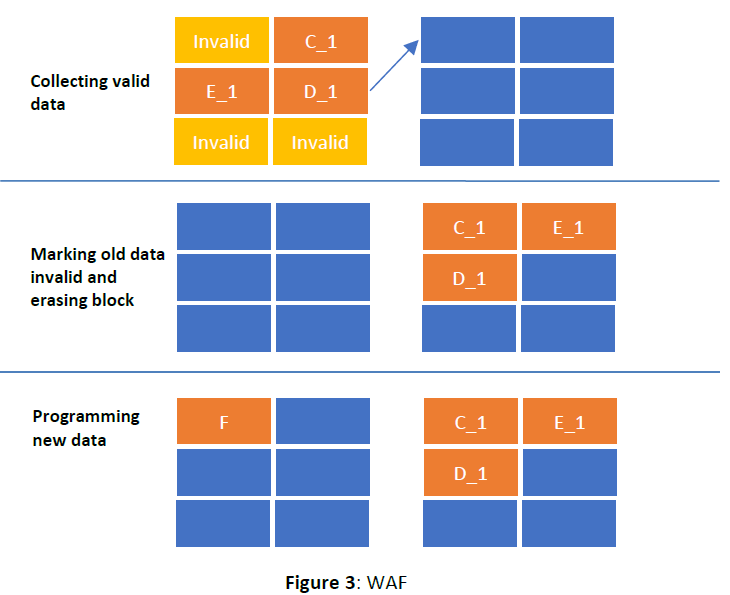
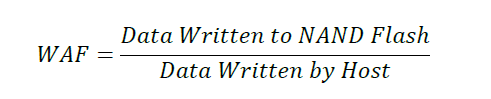
This kind of phenomenon is called Write Amplification, which means the amount of data written to the NAND exceeds the amount of data the host requires to be written. The WAF can be calculated as the ratio of the data written to flash (including copying the valid data during GC) to the amount of data to be written as requested by Host.
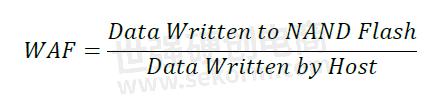
Taking the example, as shown in Figure 3, and assuming the data size of C_1, D_1, E_1 and F are all 4 KiB, the WAF of this write process can be calculated as 4. This also illustrates that the efficiency of GC will have a heavy impact on WAF. A high WAF will exacerbate the degradation of the flash memory and reduce the lifetime of the drive.
The WAF varies significantly by applying different workloads. In general, small-chunk random write will result in a much higher WAF than big-chunk sequential write. For instance, when writing 4 KiB chunk size data to the SSD with 16 KiB page size, in the case of sequential write, four chunks can be sequentially written to one physical page. While in terms of random write, every 4 KiB data will be randomly distributed to different pages or/and blocks. The data on the drive will be highly fragmented compared to a sequential write, which will result in highly fragmented invalid data during data replacement. Thus, the SSD controller will need to perform intensive GC to relocate the valid data and erase all the invalid data. This can lead to a significant drop in drive performance and a rise in WAF.
Over-Provisioning
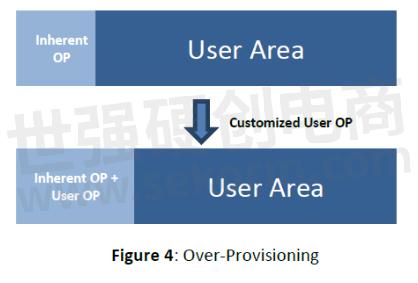
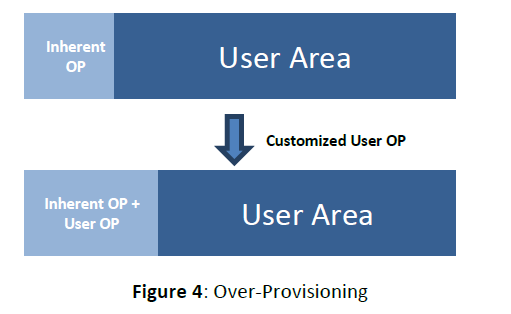
Foreseeably, when the SSD is almost full, there will not be enough free space for garbage collection. The approach to solve this dilemma is over-provisioning, which is the process of allocating extra free space into the SSD to ensure that there is always enough room for GC process. This extra area, called over-provisioned space, is inaccessible to the Host and is only accessible to the SSD controller, allowing the GC process to proceed smoothly.
OP can be calculated using the following formula:

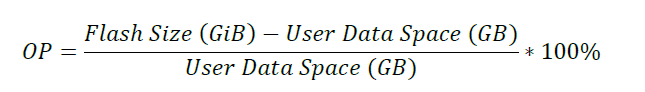
*GiB: unit symbol of Gibibyte: 230 bytes
*GB: unit symbol of Gigabyte: 109 bytes
Notice that the flash capacity is always 2 to the nth power (in the unit of GiB), while the capacity advertised by the SSD manufactures is decimal (GB). For instance, using 256 GiB Flash to build a 256 GB SSD, the SSD has an inherent OP of (256*(2^30)-256*(10^9))/(256*(10^9)) = 7.37%.
On top of the inherent OP, additional user OP can be configured depending on different application requests. For example, a 240 GB SSD built by 256 GiB flash has a total OP of (256*(2^30)-240*(10^9))/(240*(10^9)) = 14.53%.
However, in order to make it simpler, the marketing description usually refers only to the user OP. So for a 240 GB SSD, the marketed OP is (256*(10^9)-240*(10^9))/(240*(10^9)) ≈ 7%. While the marketed OP for a 256 GB SSD is 0%, according to the calculation.
In summary, if we configure the SSD to different User Capacities, the OP will be like: 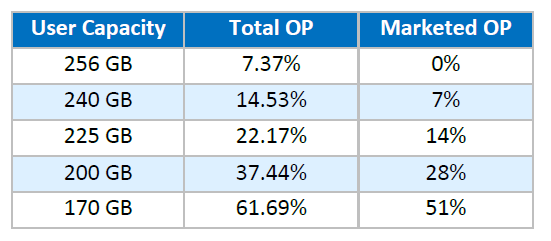
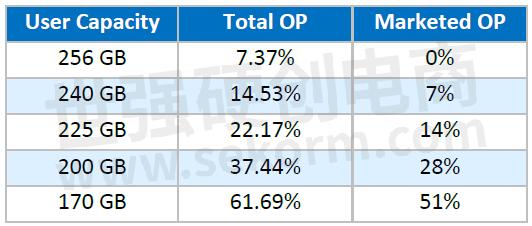
Regardless of which definition is used, OP refers to the portion of the SSD capacity that is reserved for FW algorithms like GC, wear leveling, and bad block replacement. It is inaccessible to the users.
How Over-Provisioning Impacts the TBW
Workload
WAF can vary significantly depending on the workload from the Host. In this article, a series of tests have been performed to figure out the impact of the OP size on TBW and drive performance. The workload used for testing is the Enterprise workload JEDEC 219A, with the specific parameter settings shown in the table below.
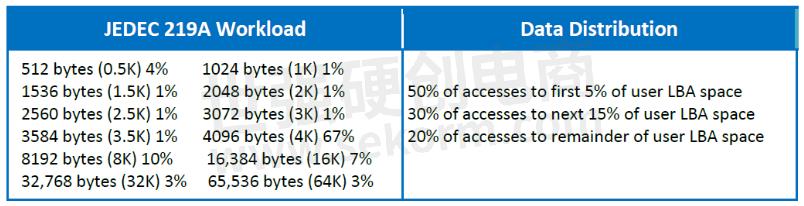
Source: www.jedec.org
The workload was used to measure the performance with the random read/write mix ratio of 40%/60%. The total amount of data being continuously and randomly written to the drive was 12x the user capacity of the drives.
OP Factor vs. WAF
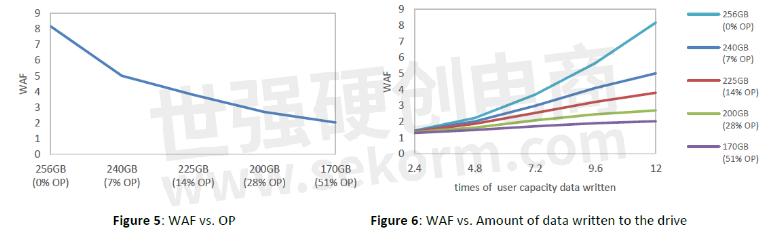
Figure 5 shows the overall WAF after writing data in the amount of 12x the user capacity size to the drive. As expected, the overall WAF decreases as the OP size increases.
Figure 6 shows how the WAF changes as data is written to drives with different OP settings. As data continues to be written, the data fragmentation within the drive becomes more and more significant, requiring more frequent GC process. With 0% OP (256 GB), the WAF increases very quickly as more and more data is written. Instead, increasing the OP can optimize the WAF as it ensures that there is enough space for GC to be carried out more efficiently.
OP Factor vs. TBW
The TBW shown in the following graph is estimated based on the relationship:
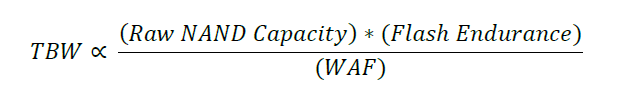
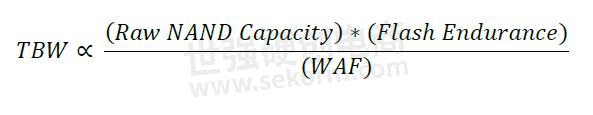
The TBW varies significantly depending on application. The following random write endurance has been calculated based on the test results in above session using JEDEC 219A enterprise workload and is not guaranteed value.
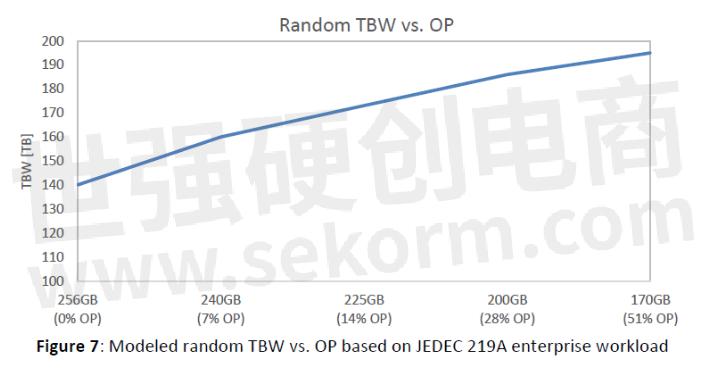
From the curve shown in Figure 7, it can be observed that TBW and OP are positively correlated, but in a non-linear fashion. After a certain point, increasing the OP does not significantly increase the TBW, but rather reduces user capacity. The customer therefore needs to choose an appropriate OP size for the actual application.
How Over-Provisioning Impacts SSD’s Performance
The garbage collection can severely impact SSD performance when it is near saturation with writes. To cope with this problem, over-provisioning provides additional space for the garbage collection process without heavily impacting the performance.
The following two graphs show the variation in peak performance and overall performance of a 256 GB SATA drive by allocating different OP sizes. These performances were measured by using the JEDEC 219 workload described in the above section, with 2.4x the user capacity size for continuous random writes.
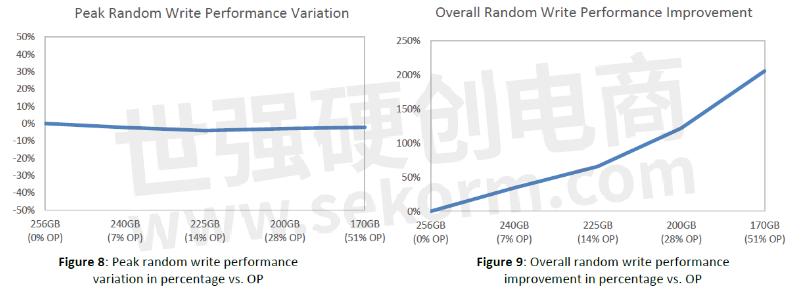
The random write performance is at its best when writing to a brand-new drive, as there is no garbage collection action yet and the OP size therefore has no impact on peak performance, like shown in Figure 8. As the drive fills up with data, the data inside the drive becomes more and more fragmented. The drive's controller must constantly mark invalid data and garbage collect them. At this point GC becomes a major factor in slowing down the performance of the drive. As you can see from the graph in Figure 9, garbage collection has less and less impact on performance as the OP size increases. And in fact, the overall random write performance increases significantly with the increase in the OP.
Conclusion
Over-provisioning contributes to improving the endurance and write performance of the SSD, but it will reduce the user capacity; therefore, it is important to allocate an optimum amount of OP depending on the application. For write-intensive workloads, it is beneficial to compromise a certain portion of capacity for a significantly improved endurance. Instead, for read-intensive workload, a lower OP can allow the customer to take the best advantage of the user capacity.
As the global leader in specialized storage and memory solutions, ATP provides unique, custom-configured solutions to meet unique requirements. ATP customizes the OP to adapt to different real-world application environments, delivering the most benefit of drive endurance, user capacity, and performance product for the customer.
- +1 Like
- Add to Favorites
Recommend
- Apacer Launches AS2280Q4U M.2 Gen4 x4 SSD for PS5 with 7400/7000MB/s Read/Write Speeds
- How Over-Provisioning Can Benefit SSD Performance SSDs
- What Are the Common SSD Myths?
- Apacer‘s Latest Industrial PCIe Gen4 x4 SSD Supports Continuous Read/Write Speeds of 5080/4735MB/s
- The Importance of Crystal Oscillator in SSD, This Article will Let You Understand in Seconds!
- Apacer‘s SV25T Transformed SSD Is a Quick and Easy Way to Adopt OOB Technology For Organizations Interested In Improving ESG Compliance
- The First FORESEE Large-capacity SSD for Vehicle-mounted Monitoring Systems Supports 24-channel High-definition Recording
- SSD End-of-Life Validation Test: Ensuring Reliability, Endurance and Retention From 0% to 100% and Beyond EOL
This document is provided by Sekorm Platform for VIP exclusive service. The copyright is owned by Sekorm. Without authorization, any medias, websites or individual are not allowed to reprint. When authorizing the reprint, the link of www.sekorm.com must be indicated.
Integrated Circuits


Discrete Components


Connectors & Structural Components


Assembly UnitModules & Accessories


Power Supplies & Power Modules


Electronic Materials


Instrumentation & Test Kit


Electrical Tools & Materials


Mechatronics


Processing & Customization